We talk about civilization as if it were a machine. Politicians promise to "fix the economy." Engineers propose to "replace" fossil fuels with renewables. Policy analysts recommend "upgrading" infrastructure. The language is mechanical: parts, systems, inputs, outputs, replacements.
But civilization is not a machine. Machines have discrete parts that can be swapped independently. Remove a gear, insert a new one, and the machine runs the same. The machine metaphor implies modularity - the idea that you can change one part without affecting the others.
This is dangerously wrong.
Civilization is a metabolism. It's a living, interconnected web of flows - energy, materials, nutrients, information, capital - where every flow depends on multiple others, where removing one input cascades through the entire system, and where the "waste" of one process is often the critical input of another.
I started thinking this way after spending months researching the decarbonization challenge. The more I looked at any single transition - replacing coal with solar, electrifying transport, building nuclear reactors - the more I found myself tracing threads into domains that seemed unrelated. Solar panels need copper. Copper mining needs diesel. Diesel refining produces sulfur. Sulfur makes sulfuric acid. Sulfuric acid processes phosphate rock. Phosphate rock becomes fertilizer. Fertilizer grows food for 4 billion people.
Try to map that chain inside a single government department or academic discipline. You can't. The chain crosses energy policy, mining regulation, chemical engineering, agricultural science, and food security - five domains that barely talk to each other.
This article is my attempt to draw the map that connects them.
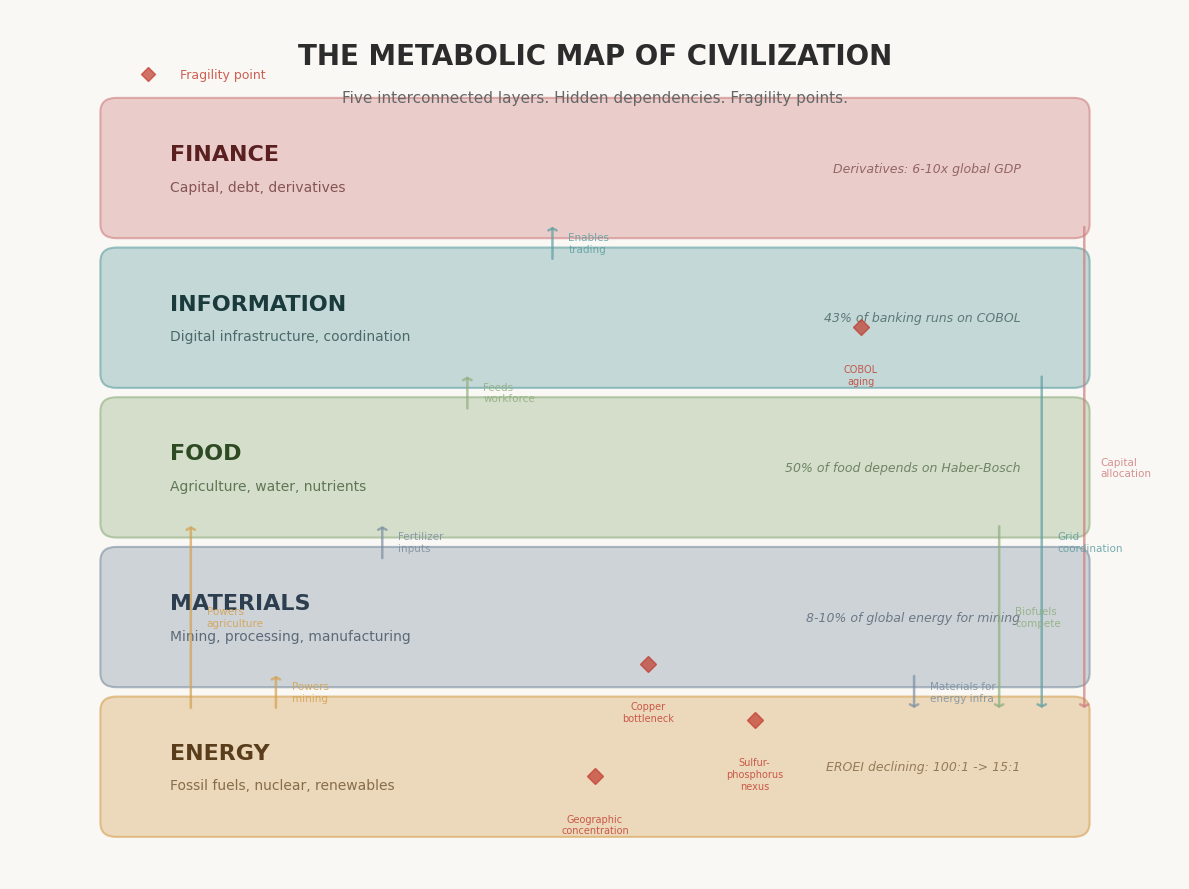
The Five Metabolic Layers
I've found it useful to think about civilizational metabolism in five layers. This is a simplification - reality is messier - but it captures the major flows and, more importantly, the dependencies between them.
Each layer transforms inputs from the layers below into outputs that enable the layers above. But the flows aren't one-directional. Every layer depends on every other in ways that are often invisible until something breaks.
Layer 1: Energy
The metabolic base. Everything else runs on this.
| Metric | Value |
|---|---|
| Global primary energy | ~600 EJ/year (2024) |
| Fossil fuel share | ~82% |
| Energy for energy (self-consumption) | ~12-15% of total |
| Historical EROEI (1930s oil) | ~100:1 |
| Current average EROEI | ~15:1 and declining |
| Minimum viable EROEI for industrial civilization | ~5-7:1 (estimated) |
EROEI - Energy Return on Energy Invested - is the metabolic rate of civilization. It measures how much surplus energy you get back for every unit you spend extracting energy. When oil was easy to find and close to the surface, you spent 1 barrel's worth of energy and got 100 back. That 99-barrel surplus is what funded everything: cities, hospitals, universities, the internet, space programs.
Today, the global average EROEI is around 15:1. Tar sands come in at 3-5:1. Deepwater oil at 4-7:1. Conventional oil fields are depleting. We're running harder to stay in place.
This matters because the energy surplus is the foundation. Every other layer - materials, food, information, finance - is built on top of the energy that's left over after the energy sector feeds itself. As EROEI declines, the surplus shrinks, and the metabolism slows down. Not dramatically, not all at once, but steadily.
Renewables complicate the picture. Solar PV has an EROEI of roughly 10-20:1 depending on location and how you account for intermittency and storage. Wind is 15-25:1. These are respectable numbers. But they come with a critical caveat: the energy is delivered as electricity, not as chemical feedstocks. Fossil fuels don't just provide energy. They provide the molecular building blocks for plastics, pharmaceuticals, fertilizers, solvents, lubricants, and thousands of other products. Electricity can't replace those functions directly. You need additional conversion steps - electrolysis, Fischer-Tropsch synthesis, carbon capture - each of which consumes energy and lowers the effective EROEI.
The energy layer isn't just about kilowatt-hours. It's about the form and density of the energy, the surplus it generates, and the chemical co-products that come along for the ride.
Layer 2: Materials
The physical substrate. Everything you can touch was mined, processed, and shaped using energy.
| Metric | Value |
|---|---|
| Global mining output | ~18 billion tonnes/year |
| Energy consumed by mining | 8-10% of global energy |
| Copper production | ~22 million tonnes/year |
| Copper needed for energy transition (IEA estimate) | ~50-70 million tonnes/year by 2040 |
| Average copper ore grade (1900) | ~4% |
| Average copper ore grade (2024) | ~0.6% |
| Steel production | ~1.9 billion tonnes/year |
| Cement production | ~4.1 billion tonnes/year |
The materials layer has a feature that most analysts overlook: the co-product web.
When you refine a barrel of crude oil, you don't just get gasoline. You get gasoline, diesel, jet fuel, naphtha, lubricating oils, waxes, asphalt, petroleum coke, and sulfur. These aren't optional byproducts you can choose to make or not. They're inherent in the chemistry of the feedstock. A barrel of crude oil yields roughly fixed proportions of each product.
This means that if you reduce demand for one product (say, gasoline, because cars go electric), you also reduce the supply of every other product that comes from the same refining process. Less gasoline means less sulfur. Less sulfur means less sulfuric acid. Less sulfuric acid means a crisis in phosphate processing - which I'll get to in the food layer.
The co-product web extends beyond oil. Copper mining produces molybdenum as a byproduct. Zinc smelting produces germanium and indium (critical for solar panels and electronics). Aluminium refining produces gallium. Platinum mining produces palladium and rhodium. In many cases, the "byproduct" has no independent production route at scale. If the primary product's demand drops, the byproduct disappears.
Declining ore grades compound this. When copper ore grade drops from 4% to 0.6%, you need to move roughly 7x more rock to get the same amount of copper. That means 7x more diesel for haul trucks, 7x more electricity for crushers and grinders, 7x more water for processing, 7x more tailings to manage. The energy cost of materials is rising at exactly the moment we need more materials for the energy transition.
Layer 3: Food
The biological layer. The one that feeds 8 billion people and has the least margin for error.
| Metric | Value |
|---|---|
| Global food production | ~6 billion tonnes/year |
| Share dependent on synthetic nitrogen (Haber-Bosch) | ~50% |
| Energy consumed by food system (production + processing + transport) | ~30% of global energy |
| Phosphorus sources | 70% Morocco/Western Sahara |
| Sulfur sources | 90% from oil/gas refining |
| Phosphorus peak (estimated) | 2030-2033 |
| Water for agriculture | ~70% of global freshwater withdrawals |
| Topsoil loss rate | ~24 billion tonnes/year |
Half the people alive today owe their existence to the Haber-Bosch process, which converts atmospheric nitrogen into ammonia using natural gas as both energy source and hydrogen feedstock. Without synthetic nitrogen fertilizer, global agricultural output would drop by roughly 50%. There is no renewable substitute at scale. Green hydrogen from electrolysis could theoretically replace natural gas as the hydrogen source, but the energy requirements are enormous, and no country has demonstrated this at agricultural scale.
The phosphorus situation is more alarming. Phosphorus is a non-substitutable element in biology - every cell needs it, every crop needs it, and there is no synthetic alternative. Unlike nitrogen, which is abundant in the atmosphere, phosphorus must be mined from phosphate rock deposits. Roughly 70% of global reserves are in Morocco and Western Sahara. Production is expected to peak between 2030 and 2033.
But here's where the metabolic map reveals something that siloed analysis misses: the sulfur-phosphorus-food nexus.
Processing phosphate rock into usable fertilizer requires sulfuric acid. Around 50% of global sulfuric acid production goes to phosphate fertilizer manufacturing. And 90% of the world's sulfur comes from oil and gas refining - it's removed from fossil fuels as a purification step (the Claus process).
Follow the logic: decarbonization reduces oil and gas refining. Reduced refining reduces sulfur output. Reduced sulfur means less sulfuric acid. Less sulfuric acid means less phosphate fertilizer. Less phosphate fertilizer means less food. For billions of people.
Nobody in energy policy is modeling this dependency. Nobody in agricultural policy is tracking sulfur supply from refineries. The IEA doesn't model food. The FAO doesn't model energy. The dependency falls between institutions.
This is exactly why the metabolic map matters.
Layer 4: Information
The coordination layer. Invisible until it fails.
| Metric | Value |
|---|---|
| Global data center energy consumption | ~460 TWh/year (2024) |
| Projected data center energy (2030) | ~1,000-1,500 TWh/year |
| Banking systems running COBOL | ~43% |
| Age of oldest critical COBOL systems | 40-60 years |
| Estimated COBOL programmers remaining | ~800,000 (avg age ~55) |
| Internet backbone: submarine cables | ~550 active cables |
| CrowdStrike outage (July 2024) | 8.5 million devices, ~$5 billion in losses |
The information layer is the nervous system of the metabolism. It coordinates all other layers - scheduling power grid dispatch, routing supply chains, executing financial transactions, managing agricultural logistics. Without digital infrastructure, the other layers don't stop existing, but they lose the coordination that makes them function at scale.
Two features of this layer stand out.
First, complexity has exceeded human comprehension. No single person understands the full software stack of any major system. The global financial system runs on layers of code written by thousands of programmers over decades, in multiple languages, with dependencies on libraries maintained by volunteers. The Log4j vulnerability in 2021 demonstrated this: a single open-source logging library, maintained primarily by two unpaid developers, turned out to be embedded in systems across every sector of the global economy. When a critical flaw was discovered, organizations spent months just figuring out where in their systems the library was used.
Second, legacy systems are aging without replacement. An estimated 43% of banking systems worldwide still run on COBOL, a programming language developed in 1959. These systems process trillions of dollars in transactions daily. The average COBOL programmer is in their mid-50s to early 60s. Universities stopped teaching COBOL decades ago. When the COVID-19 pandemic hit in 2020, US state unemployment systems - many running on COBOL mainframes from the 1970s and 1980s - buckled under the load. New Jersey's governor publicly appealed for volunteer COBOL programmers.
The information layer creates a particular kind of fragility: brittleness without warning. Physical systems degrade visibly - you can see a bridge rusting, a road cracking, a power line sagging. Digital systems fail abruptly and catastrophically. One faulty update pushed to CrowdStrike's Falcon sensor in July 2024 crashed 8.5 million Windows devices simultaneously, grounding flights, freezing hospital systems, and halting financial operations worldwide. The system went from "fully operational" to "global crisis" in minutes.
As more of the metabolic coordination shifts to digital systems - smart grids, autonomous logistics, algorithmic trading, precision agriculture - the information layer becomes a single point of failure for the entire metabolism.
Layer 5: Finance
The abstraction layer. It coordinates resource allocation but also obscures physical reality.
| Metric | Value |
|---|---|
| Global GDP | ~$105 trillion (2024) |
| Global derivatives (notional value) | ~$630-715 trillion |
| Global debt | ~$315 trillion |
| Financial sector share of US GDP (1950) | ~3% |
| Financial sector share of US GDP (2024) | ~8.5% |
| Average holding period, NYSE stock (1960) | ~8 years |
| Average holding period, NYSE stock (2024) | ~5.5 months |
Money is, at its core, a claim on future energy. A dollar bill is a token that says "the bearer is entitled to direct some quantity of physical work." When you buy a sandwich, you're directing energy flows - the diesel that transported the wheat, the natural gas that made the fertilizer, the electricity that ran the bakery ovens. The sandwich is crystallized energy with a price tag.
This is important because the financial layer has grown far beyond the physical metabolism it's supposed to coordinate. Global derivatives have a notional value of 6-7 times global GDP. Global debt exceeds 3 times global GDP. These are claims on future energy and material flows that may or may not materialize.
The financial layer serves a legitimate coordination function: it allocates capital to projects, prices risk, enables trade across time and space. But it also creates a dangerous abstraction. Financial models treat energy as a cost input that can be substituted or optimized. They don't model the physical constraints - EROEI decline, ore grade depletion, phosphorus peaking, co-product dependencies - that determine what's actually possible.
When the financial layer's models diverge from physical reality, you get crises. The 2008 financial crisis was, in part, a collision between financial abstractions (synthetic CDOs, credit default swaps) and physical reality (houses are worth what people can actually pay, which depends on wages, which depend on economic productivity, which depends on energy). The next collision may come when financial markets price a smooth energy transition while the physical metabolism reveals constraints that smooth transitions can't accommodate.
The Dependency Web
The five layers don't stack neatly. They're tangled together in a web of cross-dependencies that no single discipline maps completely. Here are the major ones:
| Dependency | Direction | Detail |
|---|---|---|
| Energy for mining | Energy -> Materials | 8-10% of global energy goes to extracting and processing raw materials |
| Energy for food | Energy -> Food | ~30% of global energy (including processing and transport) |
| Energy for data | Energy -> Information | Data centers consume ~460 TWh/year and growing rapidly |
| Materials for energy | Materials -> Energy | Can't build solar panels without silicon, silver, copper. Can't build wind turbines without rare earths, steel, concrete |
| Materials for food | Materials -> Food | Sulfur from refining -> sulfuric acid -> phosphate fertilizer. Potash mining. Limestone for soil amendment |
| Materials for information | Materials -> Information | Semiconductors need >30 critical minerals. Submarine cables need copper and steel |
| Food for labor | Food -> All layers | The workforce that operates every other layer needs calories |
| Information for coordination | Information -> All layers | Grid balancing, supply chain logistics, financial settlement |
| Finance for allocation | Finance -> All layers | Capital determines which mines open, which power plants get built, which crops get planted |
| Biofuels competition | Food ↔ Energy | Land, water, and nutrients used for biofuels can't grow food |
| Mining water competition | Materials ↔ Food | Mining and agriculture compete for water in arid regions (Chile, Australia, North Africa) |
The critical insight is that these dependencies create feedback loops and hidden constraints. You can't model the energy transition without modeling the materials requirements. You can't model the materials requirements without modeling the energy costs of declining ore grades. You can't model food security without modeling sulfur supply from refineries. You can't model any of it without modeling the financial flows that determine investment priorities.
Yet that's exactly what we do. We model each layer in isolation and then act surprised when interventions in one layer produce unexpected consequences in another.
The Fragility Points
When you draw the metabolic map with all its cross-dependencies, certain points light up as concentrations of systemic risk. These are places where a disruption would cascade across multiple layers simultaneously.
The Sulfur-Phosphorus-Food Nexus
I've covered this above, but it bears repeating because it may be the most consequential unmodeled dependency in the entire system. The path from decarbonization to food crisis runs through sulfur chemistry, and essentially no policy institution is tracking it.
The numbers: global sulfur production is approximately 80 million tonnes per year, of which roughly 90% comes from fossil fuel refining. About 50% of sulfur production becomes sulfuric acid for phosphate fertilizer. If oil refining declines by 30-50% over the next two decades (as most energy transition scenarios project), sulfur production drops by 27-45 million tonnes per year. That's a 34-56% reduction in the input needed to make fertilizer for billions of people.
Alternative sulfur sources exist - sulfide ore deposits, volcanic sulfur, recovered sulfur from metal smelting - but none are developed at the scale needed. Building that supply chain would take 10-15 years and requires investment decisions that nobody is making because nobody has connected these dots at the policy level.
The Copper Bottleneck
The energy transition is, in material terms, primarily a copper transition. Solar panels, wind turbines, electric vehicles, grid expansion, battery systems, and charging infrastructure all require substantially more copper per unit of energy than fossil fuel systems.
The IEA estimates that the energy transition will require copper production to roughly double or triple by 2040. Current global copper production is about 22 million tonnes per year. New copper mines take 15-20 years from discovery to production. Average ore grades have fallen from 4% in 1900 to 0.6% today, meaning each new mine requires more energy, more water, and more capital per tonne of output.
Meanwhile, approximately 50-60% of global copper production is concentrated in just four countries: Chile, Peru, Congo, and China. Political instability, water scarcity (Chile's copper mines are in the Atacama Desert), and regulatory uncertainty in any of these jurisdictions directly affect the feasibility of global energy transition timelines.
Geographic Concentration
Several critical metabolic inputs are concentrated in a small number of locations:
| Resource | Dominant source | Share of global supply |
|---|---|---|
| Phosphate rock | Morocco / Western Sahara | ~70% of reserves |
| Cobalt | Democratic Republic of Congo | ~73% of production |
| Rare earth processing | China | ~90% of processing |
| Advanced semiconductors | Taiwan (TSMC) | ~90% of sub-7nm chips |
| Sulfur | Middle East + Russia refineries | ~40% of production |
| Neon gas (chip lithography) | Ukraine (was ~50%) | Disrupted since 2022 |
| Palladium | Russia + South Africa | ~80% of production |
Each of these represents a point where a single political event, natural disaster, or conflict could cascade across multiple metabolic layers. The 2022 disruption of Ukrainian neon gas supplies (used in semiconductor lithography) is a recent example. The ongoing concentration of semiconductor fabrication in Taiwan is perhaps the most significant - a disruption there would affect every layer of the metabolism simultaneously.
COBOL and Digital Aging
The aging of critical digital infrastructure is a slow-motion fragility that doesn't show up in crisis scenarios because it doesn't fail dramatically - it degrades gradually. But the degradation is accelerating as the programmers who built and maintain these systems retire.
The US Federal Reserve's Fedwire system, which settles an average of $4.7 trillion in transactions per day, runs on systems with COBOL components. Most major banks, insurance companies, and government agencies worldwide have COBOL at their core. The cost of replacing these systems is estimated in the hundreds of billions of dollars. The risk of replacing them incorrectly is systemic financial disruption.
This is a metabolic fragility because the financial layer - which coordinates capital allocation across all other layers - depends on infrastructure that is slowly losing the human knowledge needed to maintain it.
Why This Map Doesn't Exist
You might expect that somewhere - in a government agency, an international organization, a research university - someone has built a comprehensive model of these cross-layer dependencies. A model that shows how energy transition scenarios affect sulfur supply, which affects food production, which affects labor availability, which affects mining output, which affects material supply for the transition itself.
That model doesn't exist. Here's why.
Institutional silos. The IEA models energy. The FAO models food and agriculture. The World Bank models economic development. The IPCC models climate. The IMF models finance. The ITU models telecommunications. Each organization has deep expertise in its domain and almost no mandate or capacity to model cross-domain dependencies. The IEA's World Energy Outlook does not model sulfur supply implications for agriculture. The FAO's food security models do not model energy transition scenarios. The cross-dependencies fall into institutional gaps.
Academic silos. University departments mirror institutional boundaries. Energy economists study energy. Agricultural scientists study crops. Materials scientists study metals. Computer scientists study systems. The incentive structure of academia - publish in your field's journals, get cited by your field's peers, win grants from your field's agencies - actively discourages the kind of cross-disciplinary work needed to map metabolic dependencies.
Methodological barriers. Each domain has developed its own modeling frameworks, assumptions, and data standards. Energy models use different time horizons than agricultural models. Financial models use different uncertainty frameworks than materials models. Integrating them isn't just a matter of connecting spreadsheets - it requires reconciling fundamentally different ways of thinking about systems.
Political incentives. No politician benefits from revealing hidden dependencies that complicate popular narratives. "We'll replace fossil fuels with renewables" is a viable political message. "We'll replace fossil fuels with renewables, but first we need to solve the sulfur supply problem for phosphate fertilizer, triple copper mining output while ore grades decline, replace aging COBOL infrastructure in the banking system, and find alternative sources for 30 critical minerals currently controlled by geopolitical rivals" is not a viable political message. The metabolic map is politically inconvenient, so it doesn't get built.
Complexity aversion. There's a deep human preference for simple narratives with clear solutions. The metabolic map reveals a system so interconnected that simple interventions always have unintended consequences. This is uncomfortable. It's much more appealing to believe that we can swap fossil fuels for renewables the way you swap a battery in a flashlight - cleanly, completely, without side effects.
We can't. The metabolism doesn't work that way.
Building the Map
I'm writing this not just as an intellectual exercise. I'm actively working on building the model that maps these cross-layer dependencies.
The project is called Heliogenesis, and its core premise is simple: before you can navigate a transition, you need to see the full terrain. You need a map that shows not just where you want to go (decarbonized energy, sustainable agriculture, resilient infrastructure) but also the dependencies you'll traverse along the way - the sulfur bridges, the copper bottlenecks, the COBOL chokepoints, the geographic concentrations.
The metabolic map I've sketched in this article is a qualitative version. The real work is making it quantitative - building integrated models that can trace a change in one layer (say, a 30% reduction in oil refining) through all its downstream effects across every other layer. Models that can identify transition pathways that don't sever critical metabolic flows. Models that can show which investments need to happen first to prevent cascading failures.
This is hard. It requires integrating data and expertise from domains that have never been integrated before. It requires a systems view that no single institution is currently equipped to take. But the alternative - continuing to plan transitions layer by layer, hoping that the cross-dependencies work themselves out - is how you get blindsided.
The metabolism of civilization is the most complex system humans have ever built. We built it incrementally, over centuries, without a blueprint. The dependencies emerged organically, unplanned, unmonitored. Nobody designed the sulfur-phosphorus-food chain. Nobody planned for 43% of banking to run on a programming language from 1959. Nobody chose to concentrate 73% of cobalt production in one of the most unstable countries on earth.
But these are the facts of the system we've inherited. And if we want to change the system without breaking it, we need to see the system whole.
That starts with drawing the map.